OBSERVE · TRAIN · DISCOVER
The training notebook ♠
Study 3: real betting sequences, naturally reached rivers, and fresh complete games.
WSRF reaches the river
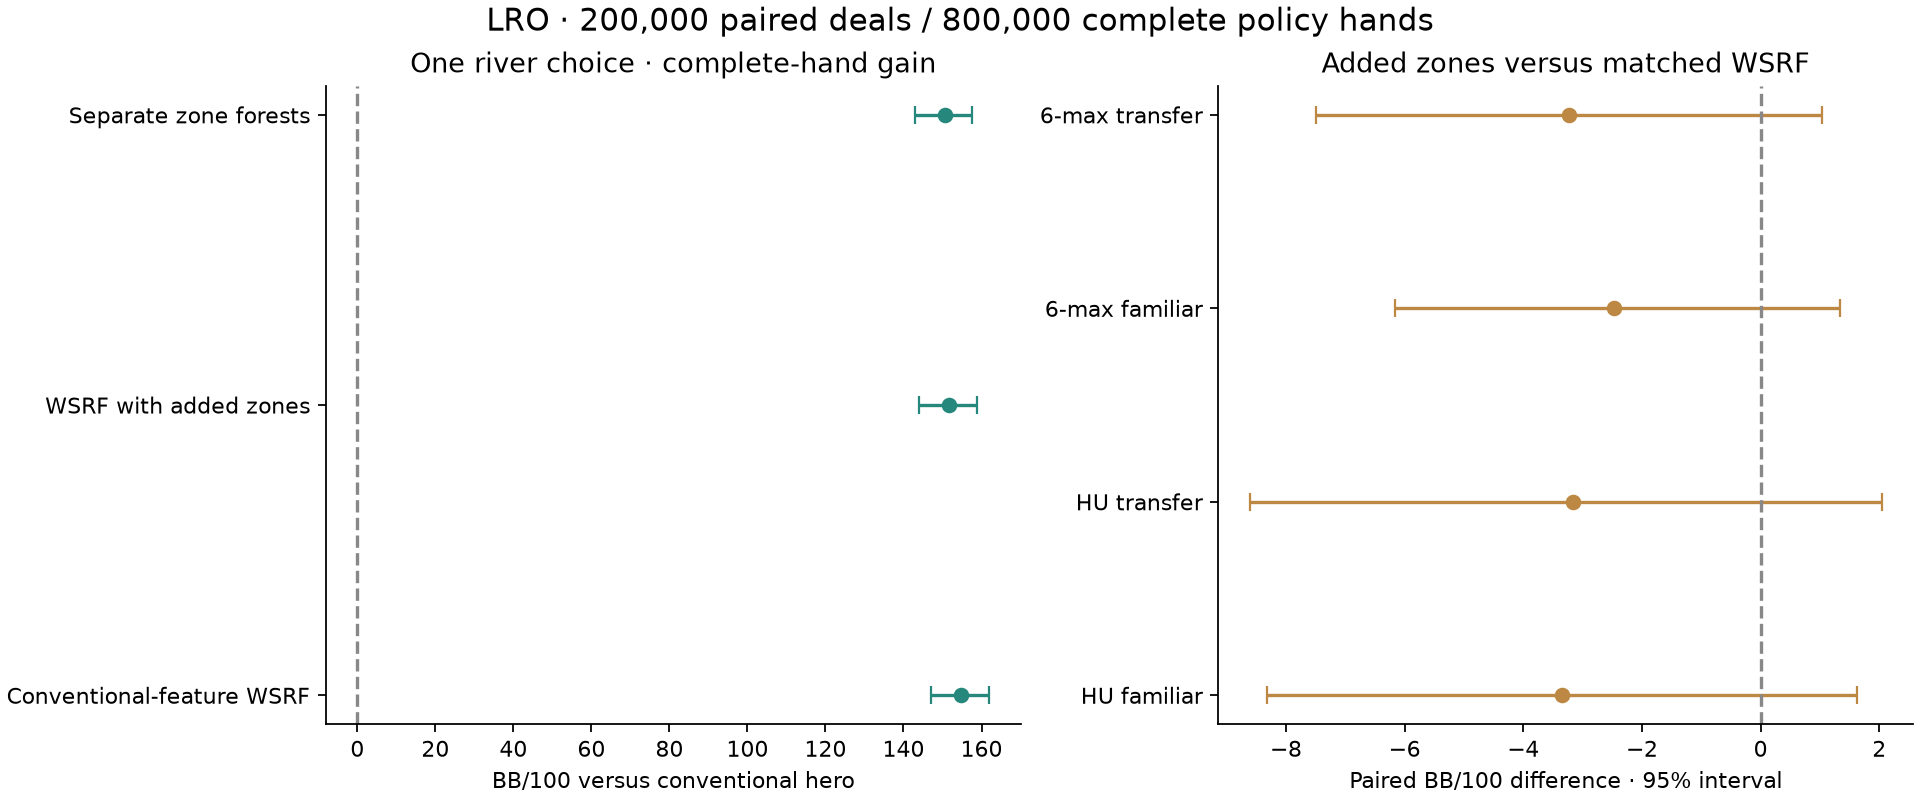
We played 500,000 complete source hands, trained nine WSRF models and gave each an adaptive update. Then we compared them on 200,000 paired deals: 800,000 complete policy hands across heads-up and six-max, familiar and held-out opponents.
Each trained policy changes one choice: the hero’s first river decision. All other choices use conventional play. That lets us measure what this learning step contributes to the complete hand.
Explore the cards and peek inside the models →
| Measure | Count |
|---|---|
| Complete source hands | 500,000 |
| Naturally reached decisions | 96,130 |
| Candidate actions / completed continuations | 467,875 / 935,750 |
| Initial / adaptive / untouched test decisions | 57,663 / 19,160 / 19,307 |
| New WSRF fits / partial-fit updates | 9 / 9 |
| Fresh paired deals / complete policy hands | 200,000 / 800,000 |
| Evaluation deals reaching a hero river choice | 44,718 |
Complete-hand results
BB per 100 complete hands, including early folds. Tables use fresh 40/100/200-BB stacks and zero rake. Brackets show pointwise 95% bootstrap intervals.
| Updated policy | BB/100 [95% interval] | Paired vs conventional | Paired vs feature baseline |
|---|---|---|---|
| Conventional policy | +31.834 [+15.790, +48.990] | +0.000 [+0.000, +0.000] | -154.728 [-161.935, -147.063] |
| Conventional-feature WSRF | +186.562 [+169.338, +204.534] | +154.728 [+147.063, +161.935] | +0.000 [+0.000, +0.000] |
| WSRF with added zones | +183.510 [+166.258, +201.804] | +151.675 [+143.995, +158.803] | -3.053 [-5.439, -0.767] |
| Separate zone forests | +182.397 [+164.942, +200.104] | +150.563 [+142.919, +157.590] | -4.165 [-6.838, -1.519] |
The conventional-feature WSRF performed better in this simulation; the added-zone difference and its interval were below zero.
Trying fresh opponents
| Context | Policy | Vs feature baseline BB/100 | Vs conventional BB/100 |
|---|---|---|---|
| 2 · familiar | WSRF with added zones | -3.350 [-8.326, +1.616] | +234.558 [+218.121, +250.763] |
| 2 · familiar | Separate zone forests | -7.620 [-13.070, -2.312] | +230.288 [+213.367, +246.751] |
| 2 · transfer | WSRF with added zones | -3.164 [-8.606, +2.042] | +173.234 [+154.726, +190.865] |
| 2 · transfer | Separate zone forests | -3.250 [-10.710, +3.961] | +173.148 [+155.361, +190.643] |
| 6 · familiar | WSRF with added zones | -2.470 [-6.170, +1.344] | +117.182 [+105.572, +130.590] |
| 6 · familiar | Separate zone forests | -1.071 [-4.998, +2.978] | +118.581 [+106.580, +131.602] |
| 6 · transfer | WSRF with added zones | -3.227 [-7.495, +1.035] | +81.727 [+69.465, +94.136] |
| 6 · transfer | Separate zone forests | -4.719 [-10.097, +0.406] | +80.235 [+67.828, +92.801] |
The transfer pool uses separate TAG, LAG, selective and balanced heuristics absent from fitting. The figures describe these simulated opponents and this one-river-choice policy. Adapting opponents and deeper strategic training are further experiments.
Likely, unlikely and commitment
| Pocket zone | Policy | Complete deals | Paired change BB/100 | River raise | River shove | Positive BB | Negative BB |
|---|---|---|---|---|---|---|---|
| likely | Conventional-feature WSRF | 161097 | +0.000 [+0.000, +0.000] | 43.9% | 35.9% | 1380616.4 | -1058569.7 |
| likely | WSRF with added zones | 161097 | -3.771 [-6.661, -1.048] | 43.7% | 35.8% | 1378478.1 | -1062506.1 |
| likely | Separate zone forests | 161097 | -4.012 [-7.029, -0.826] | 44.4% | 35.2% | 1376776.9 | -1061193.9 |
| unlikely | Conventional-feature WSRF | 38903 | +0.000 [+0.000, +0.000] | 35.8% | 27.9% | 139578.1 | -88500.4 |
| unlikely | WSRF with added zones | 38903 | -0.079 [-2.979, +2.875] | 35.3% | 27.5% | 139206.5 | -88159.6 |
| unlikely | Separate zone forests | 38903 | -4.797 [-10.031, +0.679] | 34.5% | 25.9% | 137345.5 | -88134.1 |
Pocket-zone groups include every hand. Raise and shove rates use only reached river decisions. A likely map reaches at least seven ranks within distance one; equity and confidence remain separate measurements. Both saved losses and missed value contribute to net results.
What the adaptive update changed
| Model | Local update gain · BB/river decision |
|---|---|
| Conventional-feature WSRF | -0.038 [-0.163, +0.091] |
| WSRF with added zones | +0.027 [-0.076, +0.126] |
| Separate zone forests | +0.239 [+0.113, +0.363] |
Local decision values use two sampled continuations per action. They measure a different quantity from the complete-hand rates above.
Follow the evidence
The game engine checks legal actions and conserved chips. Public-view features exclude opponent cards. Zone maps match pytoolzdfhyper, and exported trees reproduce Python WSRF predictions. Earlier studies remain available.
The live room uses conventional practice opponents. The river explorer shows trained research estimates from a deliberately varied set of synthetic test hands. Explore a choice, then reveal two simulated outcomes and compare.
Study 2: observed profiles, a million-hand audit, and constructed rivers →
Historical profile targets: MIT-licensed PHH collection. This page contains aggregate findings and local assets.