OBSERVE · TRAIN · DISCOVER
Study 2 · constructed rivers ♠
Measured playing styles, fresh decisions, and WSRF experiments you can follow.
A million complete practice hands
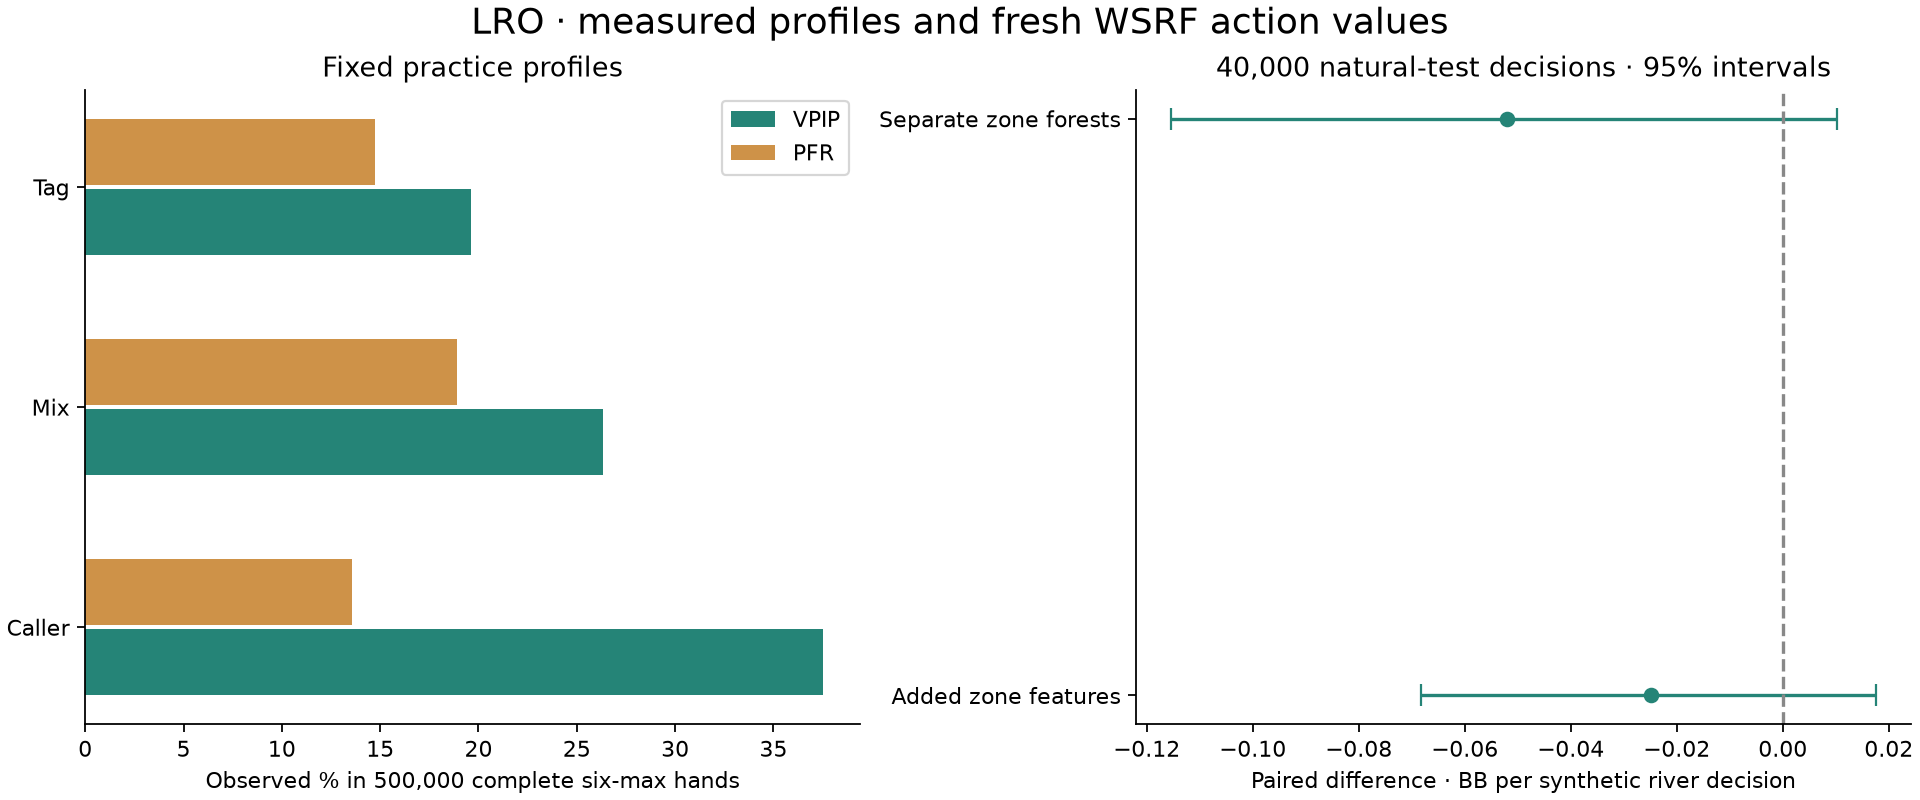
We froze the observed-profile opponents, then played 500,000 heads-up and 500,000 six-max hands to measure their tendencies. Try “Observed profiles” under Practice company. Your own HUD starts with your table’s hands; reference rates remain separate.
| Seats | Profile | Player-hands | VPIP target → audit | PFR target → audit | 3-bet target → audit | C-bet target → audit |
|---|---|---|---|---|---|---|
| 2 | caller | 333,330 | 58.79 → 59.42 | 21.68 → 21.87 | 10.02 → 9.89 | 51.85 → 55.68 |
| 2 | tag | 666,670 | 50.69 → 51.57 | 40.38 → 40.89 | 14.00 → 14.79 | 62.54 → 61.25 |
| 6 | caller | 1,000,000 | 37.86 → 37.52 | 14.00 → 13.55 | 4.49 → 4.12 | 62.03 → 59.82 |
| 6 | mix | 1,000,000 | 25.62 → 26.31 | 19.20 → 18.93 | 5.66 → 5.82 | 65.49 → 64.06 |
| 6 | tag | 1,000,000 | 19.32 → 19.64 | 15.04 → 14.76 | 5.28 → 5.14 | 67.47 → 66.28 |
Learning the value of each choice
The next WSRF study generated 220,000 isolated river decisions and trained nine models with nine adaptive updates. It compares folding, calling, raising and shoving. These river scenarios are counted separately from complete hands.
Values below are BB per eligible synthetic river decision. They are not whole-game win rates. The test contains 40,000 naturally distributed decisions. Each model uses only its own cards, the public board and betting information; hidden cards score the outcome afterward.
| Updated model | Value [95% interval] | Difference vs conventional WSRF | Raise rate | Full-stack commitment |
|---|---|---|---|---|
| Conventional features | +7.5962 [+7.3336, +7.8584] | +0.0000 [+0.0000, +0.0000] | 17.4% | 18.5% |
| Conventional + zone features | +7.5713 [+7.3020, +7.8349] | -0.0249 [-0.0682, +0.0175] | 17.6% | 18.4% |
| Separate zone forests | +7.5441 [+7.2608, +7.8252] | -0.0520 [-0.1154, +0.0102] | 17.9% | 18.2% |
| Equity / pot-odds call-or-fold | -0.1331 [-0.3988, +0.1298] | -7.7292 [-7.9632, -7.4944] | 0.0% | 10.8% |
The paired interval includes zero, so this run has yet to establish a benefit from adding zone features.
A separate unlikely-zone stress test contains 10,000 decisions. Its deliberately selected pockets stay separate from the primary average. The live room continues to use conventional practice policies; these WSRF models are research artifacts for the river subgame.
What the experiment teaches us
Likely and unlikely remain rank-distance map labels. Winning probability and model confidence are separate measurements. We track saved losses together with missed winning value, keeping the whole decision in view.
Opponents in this study use explicit synthetic value, bluff and calling rules. A raise ends with their call or fold; further reraises and the earlier streets are outside this local experiment. The next step is testing decisions reached through complete games against varied, adapting opponents.
Sources: aggregate profiles derived from the MIT-licensed PHH dataset, with WSRF and distance features supplied by pytoolzdfhyper. The website includes aggregated findings and local assets.